Here at AndroidHeadlines, we test and review a lot of phones. Just to put this in perspective, we have five people who write reviews here, and in January 2024, we published nine phone reviews. In 2023, we published 46 phone reviews throughout the year. That’s roughly one new phone review every eight days last year. So, how do we test these phones that we review here at AndroidHeadlines? Well, we do put each phone through a rigorous testing process, with many different benchmarks and tests that will tell us how good or bad different aspects of the phone are.
In this article, we are going over each test in depth. Explaining what it tells us and why we test in this method. This helps us be as transparent as possible and allows you, the reader, to know more about what to expect from our reviews.
How long does it take to review a phone?
Typically, we prefer to use a phone for at least a week before starting the review. In a perfect world, we’d be able to use it much longer than that. But with 46 phones coming across five editors’ desks in 2023, it’s pretty hard to use each phone for 15-30 days as we would like.
You’ll also find in each review, in the disclaimer section, that we tell you how we got the phone. Whether we bought it, were sent a review unit from the company, or it is a sponsored review. Again, to be as transparent as possible. We also tell you how long we used the phone, as well as the exact specs we are reviewing. For example, in this OnePlus 12 review, I stated that we had the 16GB/512GB Silky Black model, which is the top-end version of the OnePlus 12.
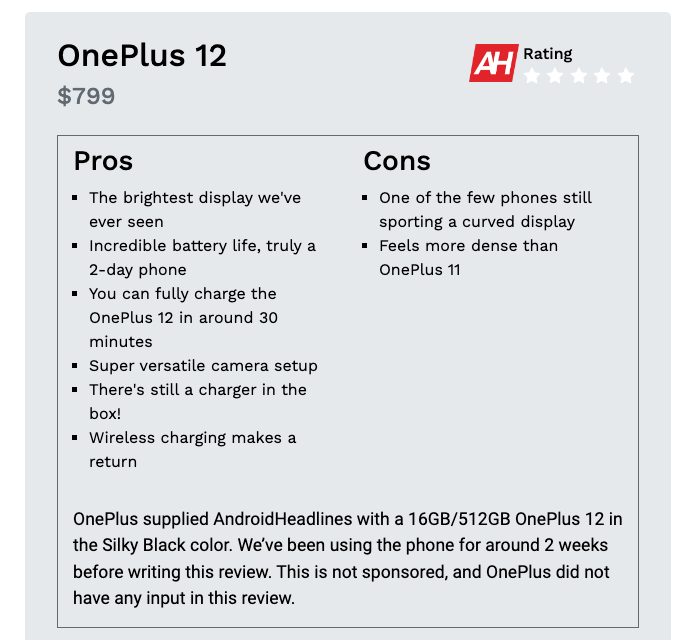
While we were using the phone during the week-long review period, we tested a lot of its features and used the phone as much as we could, like we would use our own daily driver. During that time, we take notes about things we like and things we dislike. Towards the end of the week, we start to run the tests that we’ll talk about next. Sometimes, we publish reviews before doing all of these tests. In those cases, we will go back and update the review with those test results and with more info about our experience using the phone.
Many phones, these days, are under review embargoes. And this is pretty obvious since you’ll see hundreds of reviews on the same phone going live at the same time. This does handicap us a bit, as we want to meet that deadline, but it’s not always a generous deadline. Some companies provide you a unit a month before reviews go live, while others give you a week if you’re lucky. These are the type of reviews that generally involve us going back and updating the review later on.
How we test phones
Now, let’s jump into the nitty gritty. There are six main areas that we are testing with these different benchmarks and tests. These include Performance (both CPU and GPU), Battery rundown and Charging, Camera, Audio, Thermal, and Display. Let’s start with the most straightforward testing, performance.
Performance
For performance, we run three tests. We designed two benchmarks and a separate test ourselves.
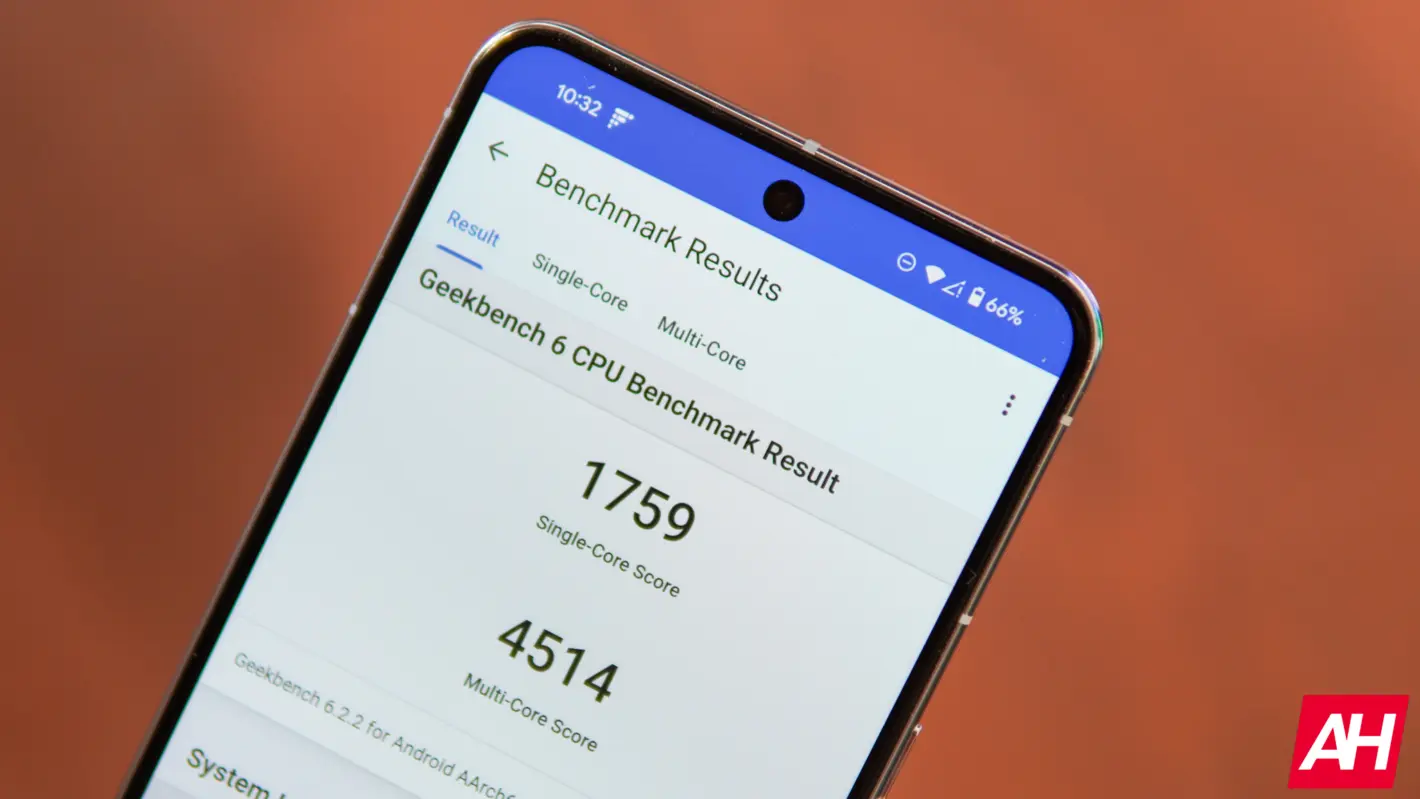
First up is Geekbench 6. This is a tried-and-true benchmark that has been used for many, many years. It has two tests that are run. One that tests the CPU and another for the GPU. It tests the raw performance of the CPU and GPU. If we notice that the result is much lower than we think it should be, we will opt to run it again. But not right away. We’ll wait 10 minutes before running it again to let the phone cool down and make things as fair as possible.
Next is the 3D Mark Wildlife Extreme Stress Test. This is a pretty cool and unique test that we run. It essentially runs a loop that lasts a minute, twenty times. So, the benchmark itself lasts the longest at about 20 minutes. In the end, it will give us three scores. A score for the Best Loop and the Lowest Loop. Those two also give us a Stability Score. This test will show us if the phone can handle a sustained load or not. Some phones have scored pretty poorly in the stability score, around 50%, while others have scored above 80%, which are typically those with great cooling systems.
Finally, we have a video test that we run. You might be thinking, what does that have to do with performance? Well, it’s a video export test. We have a video that I shot in Times Square; it’s exactly 60 seconds long. We bring that into Capcut, remove the ending that Capcut always adds, and put an effect onto the video. Then export at 1080p 30fps, which is the default setting for most phones. We time how long it takes to export, which, surprisingly, varies quite a bit. The reason for this test is many edit TikTok and Reels on their phones using Capcut. And it’s a test that phone manufacturers are less likely to “cheat” on, as we know they do on most other benchmark apps.
The scores for all of these tests are put into a spreadsheet that we then use to compare the phone we are working on reviewing with other similar phones. Or phones that we think people might be cross-shopping. For example, we compared the OnePlus 12 with the OnePlus Open, Pixel 8 Pro, and iPhone 15 Pro Max. A predecessor of sorts to the OnePlus 12, and all four phones have different processors. We then create graphs from the spreadsheet to include in the review. Giving the reader a visual representation of how the phone holds up with its competition.
Battery and Charging
Moving onto battery and charging, this test was pretty hard to put together. Since everyone uses their phones differently. But the way we found to test the phones the exact same every time was to run a YouTube video on the phone at full brightness until the phone dies. So we charge it up to 100%, open up the YouTube video, turn off auto-brightness, max out the brightness, and unplug it. The video we use is a 24-hour long video, and we record the time once the phone hits 1%. We do 100% to 1% because we want to record the time before it dies and then do a charging test from there since most people aren’t going to let their phone completely die.
Once the battery test is finished, we then plug the phone in and time how long it takes to get to 100%. We generally use the same 45W charger for these tests. The only exception is if the phone comes with a faster charger in the box – like OnePlus, OPPO, and Vivo. Then we test it with the charger in the box, as well as the same 45W charger. Giving the faster charging phone the benefit of the doubt and also testing it apples to apples with the competition.
These values are also put into a spreadsheet so we can compare them with other phones. Again, we compare with similar phones or phones we think people might be cross-shopping. So everyone can see how long the battery lasts versus similar competition and how quickly it can charge to 100%. We won’t compare a flagship phone with a mid-range phone, as that is unfair to the mid-range phone.
Camera
Perhaps the most subjective test on this list. Testing the camera is pretty difficult. But the test that we have come up with works pretty well for the default mode on most cameras.
We have a 12-inch x 12-inch photography light box in which we use a white background and put a Rubik’s cube in the center. The reason for using a Rubik’s cube is the sharp edges for background separation, as well as the different colors. It helps to see what colors are being blown out or coming in perfectly. This is also a way that we can produce the same environment across all five editors that review phones around the world.
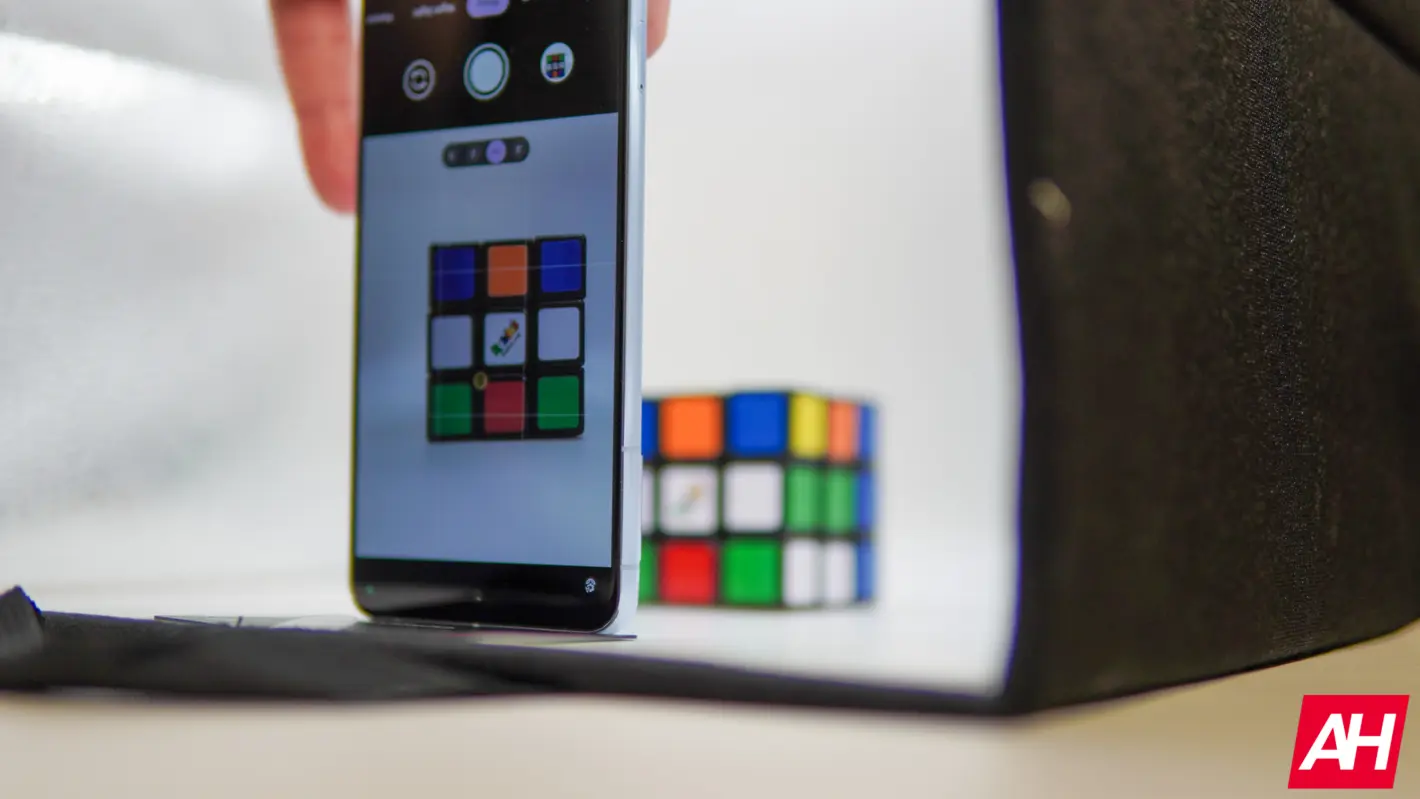
We then put the phone upside down, with a card between the edge and the phone. This way, we know that every phone is the same distance from the Rubik’s cube. To make it as similar as possible and remove as many variables as possible.
We keep these photos in a folder so we can compare future phones with older phones that we may have sent back to the manufacturer. All of the settings are default here, at 1x. The only thing we do is tap to focus. Everything else is auto.
Audio
Audio is a very subjective test for phones or really any device. Especially when you have multiple people testing phones, like we do here. But we’ve done our best to get the best tests possible for testing the audio from phones. We have six test tracks that we listen to on each phone to see how good or bad the phone’s speakers are.
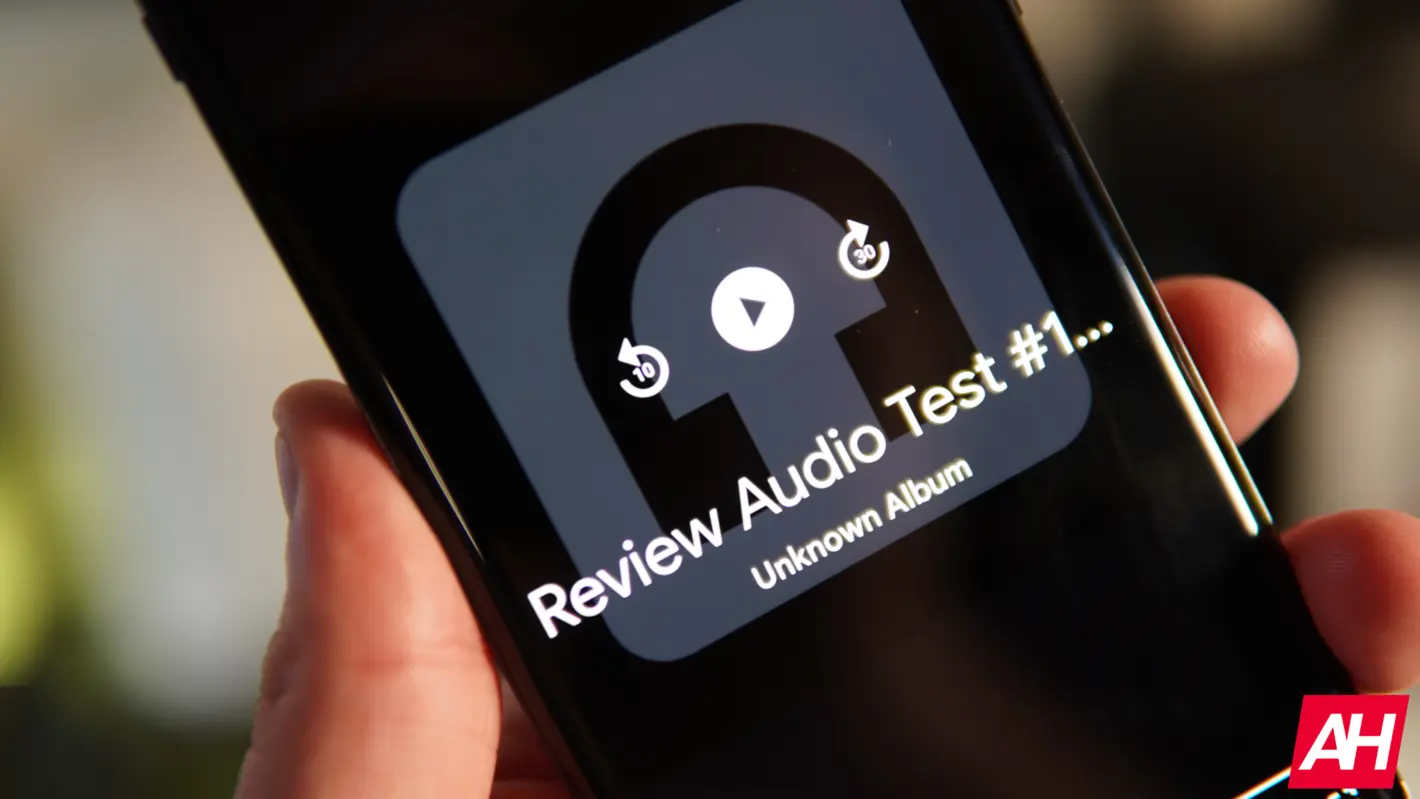
First up is the loudness and distortion test. We use a loud musical track that is meant to push the phone’s speakers to the limits. For this test, we turn the phone’s speaker up to 100% and see how loud it can get.
Next is the Bass test. This track for this test has a heavy emphasis on low-end audio, and we listen to see how well we can hear lower-end instruments in this track.
We have a test for the Treble as well. This next track has a heavy emphasis on higher-end audio, so here we are listening for clarity and how the higher tones stick out above the rest.
Next is overall balance. This is going to test out how the phone is able to balance the low and higher tones. Obviously, we don’t want one overpowering the other, otherwise it’s not a great experience.
Many of us listen to podcasts on our phones or watch YouTube videos, so vocals are also important. And that’s the next test. This track has the vocals with a little backtrack added, and we listen to see how clearly the singers’ voices stand out.
Finally, we have the immersion test. This track has a segment of a lush orchestral piece. With this track, we listen for how immersive the sound is. Does it feel like you’re fully immersed in the track or not?
Since these will all sound different to different people, we don’t track any of this in a spreadsheet. Instead, we describe how good or bad each test was on the phone in our review.
Thermals
Thermals are one of the least talked about but are the most important aspects of a phone. Why? You don’t want your phone overheating often, as that will damage the battery and potentially other components inside the phone. So, to test out the thermals, we have designed three tests that will likely come up with different results.

The first one is a test that we already ran in the performance section – the 3D Mark Wildlife Stress Test. Because this is pushing the phone to its limits for 20 minutes straight, phones get very hot here. This should be the highest temperature we see on a phone from the three tests. After the test was complete, we used our Thermal Heat Gun to check the temperature of the phone.
The next test is with Genshin Impact. We download the game onto our phone we are reviewing, and let the installation process begin, since it does have about 28GB of files to download, it’ll take some time. Then we launch the game, go directly into the Settings menu to make sure graphics are set to “high,” and play the game for an hour. After an hour, we used our Thermal Heat Gun to measure the temperature of the phone.
The final test is a 4K Video Recording test. You’ve likely noticed that recording video for quite some time can result in the phone getting pretty hot. So what we do here is we start a recording at 4K60 (we opted for 4K60 since not every phone has 4K120 or an 8K option), and use our Thermal Heat Gun to check the temperature at different intervals. We check at 5 minutes in and then again at 10 minutes in, to see how hot the phone really gets.
All three of these tests are done at full brightness. You’re likely playing Genshin Impact at full or almost full brightness, and if you’re recording video outside, it’ll be at full brightness. These results are recorded in a spreadsheet so we can compare the temperatures versus other phones. Some phones are known to run hot, while others have huge vapor chambers inside that should stay nice and cool.
Display
To test the displays on phones, we use a flashlight that shines at the light sensor. This forces the phone to go as bright as possible. Then, we use a Lux Meter to measure the Lux of the screen, which shows a plain white image across the entire screen. This is done in a dark room so that no other light source is affecting the results here.
We measure this for both Manual and Auto-Brightness. So, for manual, we will turn off auto brightness or adaptive brightness. Move the brightness slider to max, and measure the brightness of the white image on the screen.
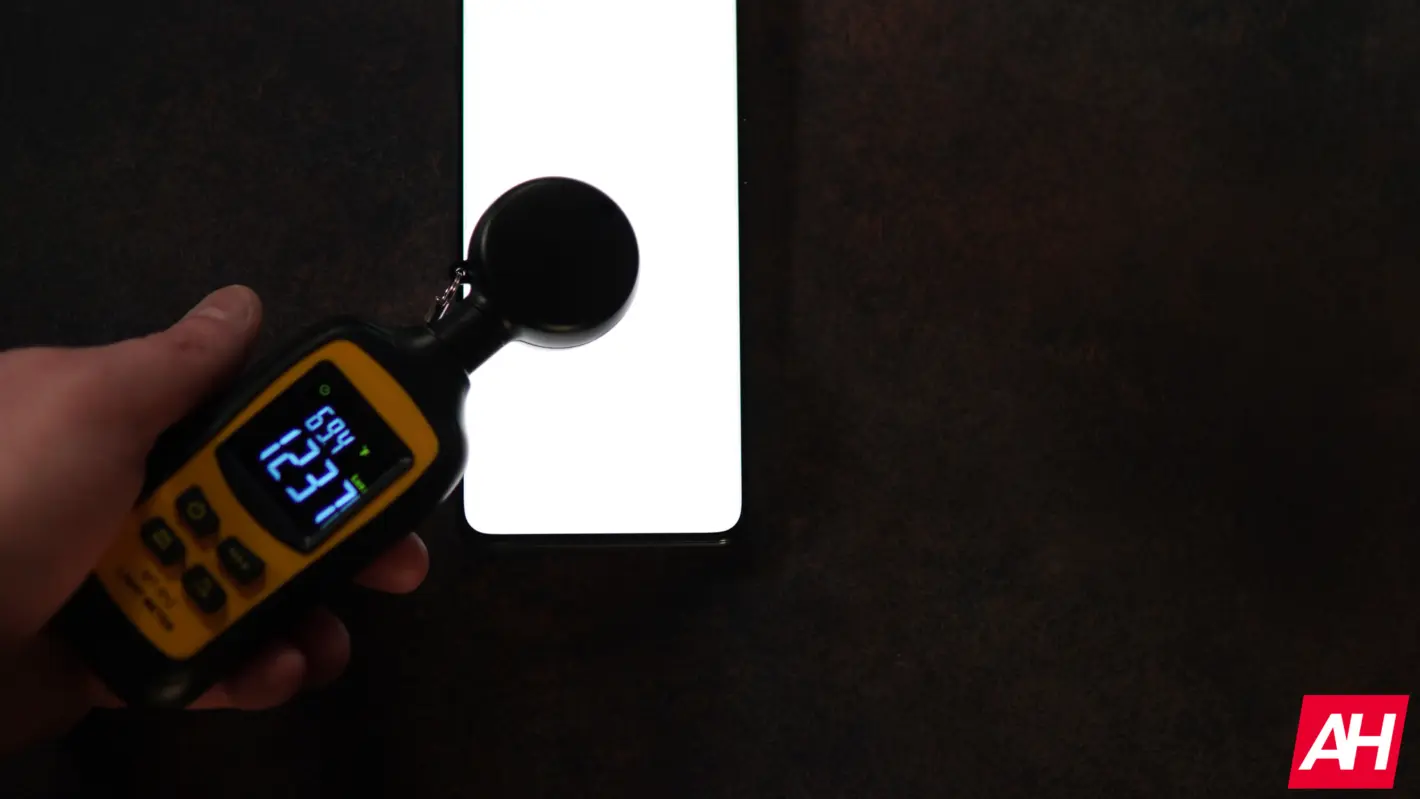
For auto-brightness, we need to use a flashlight on the light sensor, which is normally at the top of the screen. This forces the phone to go as bright as possible, and from there, we can use the Lux Meter to measure the phone’s brightness.
The results from both of these tests are placed into our reviews. However, we do not record them in the spreadsheet since phones vary so much with their peak brightness and HBM numbers.
Reviews vs. Hands-On
To wrap things up here, I want to take a minute and explain the difference between a hands-on article and a review. These two typically get confused, and they really shouldn’t be confused with each other.
A hands-on article is typically our first thought on a product. They typically come from events where we get a chance to use the product in a controlled environment for a limited amount of time. The lighting is usually pretty good there, which affects how good the camera might look. And that’s why we wait to make judgments on the camera until we get it in our own hands.
Reviews are accompanied by a star rating out of five stars and might come with an Editor’s Choice award if it’s a good enough product. These articles are also much longer, usually over 4,000 words – lately closer to 5,000-6,000 words. While hands-on articles are more likely to be 500 words. Reviews also include all of the tests above, as well as our real-world usage.

