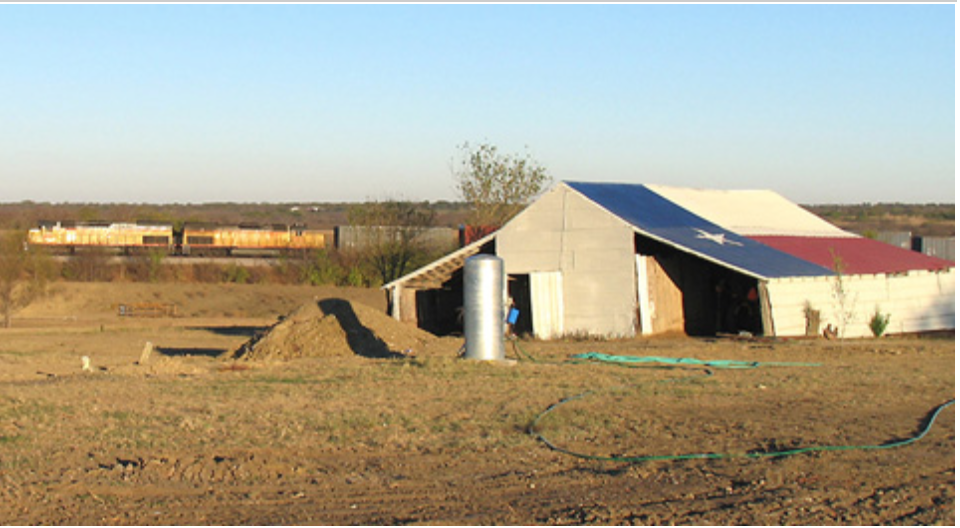
In Texas in 2015 there were 52 railroads operating including three Class I railroad companies. The local or switching lines in operation made up only about 12 percent of the state's total track mileage. In 2015, the latest data available, railroads in the state carried more than 240 million tons of freight.
| Class of Railroad in Texas | Number | Miles Operated |
|---|---|---|
| Class I | 3 | 12,092 |
| Union Pacific Railroad Co. | 6,305 | |
| BNSF Railway Co. | 4,860 | |
| Kansas City Southern Railway Co. | 927 | |
| Regional | 0 | 0 |
| Local | 27 | 1,334 |
| Switching & Terminal | 22 | 967 |
| Total | 52 | 14,393 |
| TOTAL excluding trackage rights1 | 10,539 | |
| 1Track provided by another railroad. |
 |
A Class I railroad has operating revenues of at least $433.2 million.
A regional railroad has revenues of at least $40 million, or operates at least 350 miles of track and has revenues of at least $20 million.
A local railroad engages in line-haul service but does not meet the criteria for Class I or regional.
Switching and terminal railroads engage primarily in terminal services for other railroads.
| Traffic Originated in Texas in 2015 | Carloads | Percent |
|---|---|---|
| Intermodal | 710,000 | 34 percent |
| Chemicals | 447,300 | 21 percent |
| Nonmetallic Minerals | 277,300 | 13 percent |
| Petroleum | 119,100 | 6 percent |
| Transportation Equipment | 106,700 | 5 percent |
| All Other/Unknown | 458,700 | 22 percent |
| TOTAL | 2,119,100 | 100 percnet |
| Traffic Terminated in Texas in 2015 | Carloads | Percent |
|---|---|---|
| Intermodal | 963,900 | 28 percent |
| Nonmetallic minerals | 503,600 | 14 percent |
| Coal | 477,800 | 13 percent |
| Chemicals | 320,200 | 9 percent |
| Farm Products | 183,500 | 5 percent |
| All Other/Unknown | 1,107,900 | 31 percent |
| TOTAL | 3,576,900 | 100 percent |
State Rankings for Freight Carried in 2012
| Originated | Tons | Terminated | Tons |
|---|---|---|---|
| 1. Wyoming | 434.3 million | 1. Texas | 206.6 million |
| 2. Illinois | 115.9 million | 2. Illinois | 157.8 million |
| 3. Texas | 92.9 million | 3. California | 98.9 million |
| 4. West Virginia | 92.3 million | 4. Virginia | 77.6 million |
| 5. Minnesota | 90.3 million | 5. Ohio | 77.3 million |
Source: Association of American Railroads.


