Bearish signal on daily chart
In the last 19 years, only 2.03 % trading sessions saw intraday declines higher than 5 % .
In the last 19 years, only 2.03 % trading sessions saw intraday declines higher than 5 % .
Company has spent less than 1% of its operating revenues towards interest expenses and 4.9% towards employee cost in the year ending Mar 31, 2024. (Source: Consolidated Financials)
Daily MACD crossover appeared yesterday. Average price decline of -3.35% within 10 days of this signal in last 10 years.
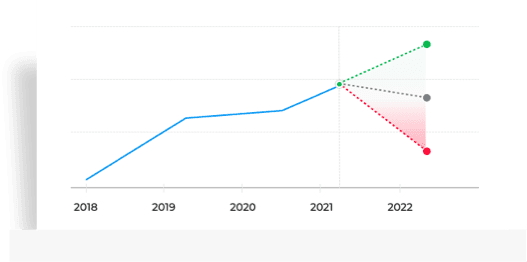
Stock gave a 3 year return of 59.24% as compared to Nifty Midcap 100 which gave a return of 101.28%. (as of last trading session)
Finolex Industries Ltd. share price moved down by -0.92% from its previous close of Rs 304.40. Finolex Industries Ltd. stock last traded price is 301.60
| Share Price | Value |
|---|---|
| Today/Current/Last | 301.60 |
| Previous Day | 304.40 |
PE Ratio (x) | 21.79 | ||||||||||
EPS - TTM (₹) | 13.84 | ||||||||||
MCap (₹ Cr.) | 18,887.32 | ||||||||||
Sectoral MCap Rank | 3 | ||||||||||
PB Ratio (x) | 3.35 | ||||||||||
Div Yield (%) | 0.83 | ||||||||||
Face Value (₹) | 2.00 | ||||||||||
Beta Beta
| 1.28 | ||||||||||
VWAP (₹) | 302.50 | ||||||||||
52W H/L (₹) |
| 1 Day | -0.92% |
| 1 Week | -2.91% |
| 1 Month | 5.45% |
| 3 Months | -8.99% |
| 1 Year | 32.8% |
| 3 Years | 59.24% |
| 5 Years | 176.52% |
 These 10 stocks will trade ex-dividend from tomorrow. Do you own any?
 Q1 results today: ICICI Bank, Dr Reddy's among 34 companies to announce earnings on Saturday
 Technical Breakout Stocks: How to trade Finolex Industries, M&M and HAL on Wednesday
Shareholder Meeting / Postal Ballot-Outcome of AGM
Announcements
Current
Mean Recos by 15 Analysts
| Ratings | Current | 1 Week Ago | 1 Month Ago | 3 Months Ago |
|---|---|---|---|---|
| Strong Buy | 2 | 2 | 2 | 3 |
| Buy | 2 | 2 | 2 | 3 |
| Hold | 10 | 10 | 10 | 7 |
| Sell | 1 | 1 | 1 | 1 |
| Strong Sell | - | - | - | - |
| # Analysts | 15 | 15 | 15 | 14 |
Employee & Interest Expense
Company has spent less than 1% of its operating revenues towards interest expenses and 4.9% towards employee cost in the year ending Mar 31, 2024. (Source: Consolidated Financials)| Quarterly | Annual | Jun 2024 | Mar 2024 | Dec 2023 | Sep 2023 | Jun 2023 |
|---|---|---|---|---|---|
| Total Income | 1,195.39 | 1,279.21 | 1,054.81 | 944.50 | 1,219.43 |
| Total Income Growth (%) | -6.55 | 21.27 | 11.68 | -22.55 | 4.20 |
| Total Expenses | 542.93 | 1,053.17 | 927.36 | 807.55 | 1,061.09 |
| Total Expenses Growth (%) | -48.45 | 13.57 | 14.84 | -23.89 | 12.00 |
| EBIT | 652.46 | 226.04 | 127.45 | 136.95 | 158.34 |
| EBIT Growth (%) | 188.65 | 77.36 | -6.94 | -13.51 | -28.94 |
| Profit after Tax (PAT) | 500.73 | 164.90 | 95.40 | 97.96 | 115.33 |
| PAT Growth (%) | 203.66 | 72.85 | -2.61 | -15.06 | -30.73 |
| EBIT Margin (%) | 54.58 | 17.67 | 12.08 | 14.50 | 12.98 |
| Net Profit Margin (%) | 41.89 | 12.89 | 9.04 | 10.37 | 9.46 |
| Basic EPS (₹) | 8.10 | 2.67 | 1.54 | 1.58 | 1.86 |
All figures in Rs Cr, unless mentioned otherwise
| Annual | FY 2024 | FY 2023 | FY 2022 | FY 2021 | FY 2020 |
|---|---|---|---|---|---|
| Total Assets | 7,057.85 | 6,285.07 | 5,345.37 | 4,293.88 | 2,891.34 |
| Total Assets Growth (%) | 12.30 | 17.58 | 24.49 | 48.51 | -13.24 |
| Total Liabilities | 1,423.58 | 1,382.00 | 1,417.56 | 1,154.92 | 905.36 |
| Total Liabilities Growth (%) | 3.01 | -2.51 | 22.74 | 27.56 | 19.67 |
| Total Equity | 5,634.27 | 4,903.07 | 3,927.81 | 3,138.96 | 1,985.98 |
| Total Equity Growth (%) | 14.91 | 24.83 | 25.13 | 58.06 | -22.91 |
| Current Ratio (x) | 2.90 | 2.55 | 2.54 | 2.12 | 1.77 |
| Total Debt to Equity (x) | 0.07 | 0.11 | 0.07 | 0.06 | 0.14 |
| Contingent Liabilities | 0.00 | 182.32 | 157.30 | 124.91 | 114.01 |
All figures in Rs Cr, unless mentioned otherwise
Cash from Operations vs PAT
Operating cash flow of Rs 353.3 cr is 0.75 times compared to the reported net profit of Rs 473.59 cr. (Source: Consolidated Financials)Decrease in Cash from Investing
Company has used Rs 82.97 cr for investing activities which is an YoY decrease of 71.16%. (Source: Consolidated Financials)| Annual | FY 2024 | FY 2023 | FY 2022 | FY 2021 | FY 2020 |
|---|---|---|---|---|---|
| Net Cash flow from Operating Activities | 353.30 | 301.69 | 621.99 | 940.98 | 106.29 |
| Net Cash used in Investing Activities | -82.97 | -287.74 | -440.34 | -876.57 | 49.13 |
| Net Cash flow from Financing Activities | -276.74 | -28.94 | -189.50 | -90.30 | -104.65 |
| Net Cash Flow | -6.41 | -14.99 | -7.85 | -25.89 | 50.77 |
| Closing Cash & Cash Equivalent | 2.15 | 8.56 | 23.55 | 31.40 | 57.29 |
| Closing Cash & Cash Equivalent Growth (%) | -74.88 | -63.65 | -25.00 | -45.19 | 656.16 |
| Total Debt/ CFO (x) | 1.08 | 1.74 | 0.45 | 0.22 | 2.66 |
All figures in Rs Cr, unless mentioned otherwise
| Annual | FY 2024 | FY 2023 | FY 2022 | FY 2021 | FY 2020 |
|---|---|---|---|---|---|
| Return on Equity (%) | 8.40 | 5.11 | 26.76 | 23.50 | 16.74 |
| Return on Capital Employed (%) | 10.89 | 6.29 | 24.66 | 29.27 | 18.34 |
| Return on Assets (%) | 6.71 | 3.98 | 19.66 | 17.18 | 11.50 |
| Interest Coverage Ratio (x) | 20.98 | 15.18 | 78.49 | 135.23 | 35.77 |
| Asset Turnover Ratio (x) | 0.65 | 0.76 | 0.97 | 80.64 | 103.22 |
| Price to Earnings (x) | 32.26 | 42.19 | 9.14 | 10.72 | 14.58 |
| Price to Book (x) | 2.71 | 2.15 | 2.45 | 2.52 | 2.44 |
| EV/EBITDA (x) | 20.40 | 26.66 | 8.86 | 7.33 | 10.55 |
| EBITDA Margin (%) | 17.71 | 9.40 | 23.79 | 30.63 | 15.99 |
Bullish / Bearish signals for Finolex Inds. basis selected technical indicators and moving average crossovers.
MACD Crossover
Bearish signal on daily chart
Appeared on: 18 Sep 2024
Region: Positive
| Date | 10 days Gain/Loss % |
|---|---|
| 13 Jun 2024 | -3.87% |
| 31 May 2024 | 1.46% |
| 9 May 2024 | -1.32% |
| 15 Apr 2024 | -1.50% |
Average price decline of -3.35% within 10 days of Bearish signal in last 10 years
20 Day EMA Crossover
Bearish signal on daily chart
Appeared on: 17 Sep 2024
20D EMA: 304.97
| Date | 7 days Gain/Loss % |
|---|---|
| 30 Jul 2024 | -11.05% |
| 19 Jul 2024 | -6.16% |
| 4 Jul 2024 | -5.13% |
| 2 Jul 2024 | -0.14% |
Average price decline of -3.58% within 7 days of Bearish signal in last 5 years
| R1 | R2 | R3 | PIVOT | S1 | S2 | S3 | |
|---|---|---|---|---|---|---|---|
| Classic | 304.83 | 308.07 | 313.72 | 302.42 | 299.18 | 296.77 | 291.12 |
| 5 DAYS | 14 DAYS | 28 DAYS | |
|---|---|---|---|
| ATR | 6.14 | 8.16 | 9.55 |
Stock Returns vs Nifty Midcap 100
Stock gave a 3 year return of 59.24% as compared to Nifty Midcap 100 which gave a return of 101.28%. (as of last trading session)Choose from Peers
Choose from Stocks
Stock Returns vs Nifty Midcap 100
Stock gave a 3 year return of 59.24% as compared to Nifty Midcap 100 which gave a return of 101.28%. (as of last trading session)1,078.87
Amount Invested (in Cr.)
3.26%
% of AUM
0.00
% Change (MoM basis)
189.97
Amount Invested (in Cr.)
0.56%
% of AUM
0.00
% Change (MoM basis)
186.63
Amount Invested (in Cr.)
1.1%
% of AUM
-9.52
% Change (MoM basis)
MF Ownership as on 31 August 2024
| Meeting Date | Announced on | Purpose | Details |
|---|---|---|---|
| Jul 27, 2024 | Jul 22, 2024 | Board Meeting | Quarterly Results |
| May 10, 2024 | May 03, 2024 | Board Meeting | Audited Results & Final Dividend |
| Jan 18, 2024 | Jan 10, 2024 | Board Meeting | Quarterly Results |
| Oct 21, 2023 | Oct 16, 2023 | Board Meeting | Quarterly Results |
| Aug 28, 2023 | Aug 08, 2023 | AGM | Rs.1.5000 per share(75%)Final Dividend & A.G.M. |
| Type | Dividend | Dividend per Share | Ex-Dividend Date | Announced on |
|---|---|---|---|---|
| Final | 125% | 2.5 | Sep 11, 2024 | May 10, 2024 |
| Final | 75% | 1.5 | Aug 21, 2023 | May 23, 2023 |
| Special | 100% | 2.0 | Aug 22, 2022 | May 20, 2022 |
| Final | 100% | 2.0 | Aug 22, 2022 | May 19, 2022 |
| Special | 100% | 2.0 | Sep 14, 2021 | Jun 26, 2021 |
| All Types | Ex-Date | Record Date | Announced on | Details |
|---|---|---|---|---|
| Splits | Apr 15, 2021 | Apr 16, 2021 | Feb 01, 2021 | Split: Old FV10.0| New FV:2.0 |
| Rights | Jul 16, 1992 | Jul 07, 1992 | Sep 30, 1992 | Rights ratio: 1 share for every 2 held at a price of Rs 40.0 |
| Bonus | - | - | May 06, 1989 | Bonus Ratio: 4 share(s) for every 1 shares held |
Finolex Industries Ltd., incorporated in the year 1981, is a Mid Cap company (having a market cap of Rs 18,713.58 Crore) operating in Plastics sector. Finolex Industries Ltd. key Products/Revenue Segments include PVC Pipes & Fittings, Scrap and Other Operating Revenue for the year ending 31-Mar-2023. Show More
Prakash P Chhabria
Executive ChairmanAjit Venkataraman
Managing DirectorRitu P Chhabria
Non Exe.Non Ind.DirectorSaurabh S Dhanorkar
Non Exe.Non Ind.DirectorIndustry
Key Indices Listed on
Nifty 500, BSE 500, BSE 250 SmallCap Index, + 9 more
Address
Gat No. 399, Village Urse,Taluka Maval,Pune District, Maharashtra - 410506
DATA SOURCES: TickerPlant (for live BSE/NSE quotes service) and Dion Global Solutions Ltd. (for corporate data, historical price & volume, F&O data). Sensex & BSE Quotes and Nifty & NSE Quotes are real-time and licensed from BSE and NSE respectively. All timestamps are reflected in IST (Indian Standard Time).
DISCLAIMER: Any and all content on this website including tools/analysis is provided to you only for convenience and on an “as-is, as- available” basis without representation and warranties of any kind. The content and any output of such tools/analysis is for informational purposes only and should not be relied upon or construed as an investment advice or guarantee for any specific performance/returns advice or considered as recommendation for the purchase or sale of any security or investment. You are advised to exercise caution, discretion and independent judgment with regards to the same and seek advice from professionals and certified experts before taking any decisions.
By using this site, you agree to the Terms of Service and Privacy Policy.