In the last 19 years, only 1.08 % trading sessions saw intraday declines higher than 5 % .
L&T - Larsen & Toubro Share Price
Loading...
L&T - Larsen & Toubro S...
Advertisment
L&T share price insights
View All
Company's annual revenue growth of 20.94% outperformed its 3 year CAGR of 17.16%. (Source: Consolidated Financials)
Daily MACD crossover appeared yesterday. Average price decline of -2.57% within 10 days of this signal in last 10 years.
Stock gave a 3 year return of 111.34% as compared to Nifty 100 which gave a return of 49.32%. (as of last trading session)
Larsen & Toubro Ltd. share price moved down by -1.37% from its previous close of Rs 3,624.15. Larsen & Toubro Ltd. stock last traded price is 3,574.75
Share Price Value Today/Current/Last 3,574.75 Previous Day 3,624.15
Key Metrics
PE Ratio (x) | 36.81 | ||||||||||
EPS - TTM (₹) | 97.11 | ||||||||||
MCap (₹ Cr.) | 4,91,473 | ||||||||||
Sectoral MCap Rank | 1 | ||||||||||
PB Ratio (x) | 4.86 | ||||||||||
Div Yield (%) | 0.95 | ||||||||||
Face Value (₹) | 2.00 | ||||||||||
Beta Beta
| 1.38 | ||||||||||
VWAP (₹) | 3,568.93 | ||||||||||
52W H/L (₹) |
L&T Share Price Returns
| 1 Day | -1.37% |
| 1 Week | -3.51% |
| 1 Month | -0.04% |
| 3 Months | 2.65% |
| 1 Year | 30.92% |
| 3 Years | 111.0% |
| 5 Years | 169.05% |
L&T News & Analysis

L&T Share Analysis
Unlock Stock Score, Analyst' Ratings & Recommendations

- View Stock Score on a 10-point scale
- See ratings on Earning, Fundamentals, Valuation, Risk & Price
- Check stock performance
JOIN ET PRIME
L&T Share Recommendations
Recent Recos
BUY
Current
Mean Recos by 29 Analysts
Strong
SellSellHoldBuyStrong
Buy
SellSellHoldBuyStrong
Buy
- Target₹6300
- OrganizationMotilal Oswal Financial Services
- BUY
- Target₹292
- OrganizationHDFC Securities
- BUY
Analyst Trends
| Ratings | Current | 1 Week Ago | 1 Month Ago | 3 Months Ago |
|---|---|---|---|---|
| Strong Buy | 11 | 11 | 13 | 13 |
| Buy | 14 | 14 | 15 | 14 |
| Hold | 2 | 2 | 2 | 2 |
| Sell | 1 | 1 | 1 | 1 |
| Strong Sell | 1 | 1 | 1 | 1 |
| # Analysts | 29 | 29 | 32 | 31 |
View all
Stock Recommendations
L&T Financials
Income (P&L)
Balance Sheet
Cash Flow
Ratios
MD&A
Insights
Beating 3 Yr Revenue CAGR
Company's annual revenue growth of 20.94% outperformed its 3 year CAGR of 17.16%. (Source: Consolidated Financials)Employee & Interest Expense
Company has spent 1.6% of its operating revenues towards interest expenses and 18.62% towards employee cost in the year ending Mar 31, 2024. (Source: Consolidated Financials)
Quarterly | Annual Jun 2024 Mar 2024 Dec 2023 Sep 2023 Jun 2023 Total Income 56,040.46 68,120.42 55,965.57 52,157.02 49,027.93 Total Income Growth (%) -17.73 21.72 7.30 6.38 -17.01 Total Expenses 50,502.45 60,772.28 50,289.57 46,301.94 43,844.20 Total Expenses Growth (%) -16.90 20.84 8.61 5.61 -16.26 EBIT 5,538.01 7,348.14 5,676.00 5,855.08 5,183.73 EBIT Growth (%) -24.63 29.46 -3.06 12.95 -22.87 Profit after Tax (PAT) 2,785.72 4,396.12 2,947.36 3,222.63 2,493.00 PAT Growth (%) -36.63 49.15 -8.54 29.27 -37.47 EBIT Margin (%) 9.88 10.79 10.14 11.23 10.57 Net Profit Margin (%) 4.97 6.45 5.27 6.18 5.08 Basic EPS (₹) 20.26 31.98 21.44 22.94 17.74 All figures in Rs Cr, unless mentioned otherwise
Annual FY 2024 FY 2023 FY 2022 FY 2021 FY 2020 Total Assets 3,39,627.24 3,30,352.31 3,20,048.92 3,11,273.71 3,08,140.13 Total Assets Growth (%) 2.81 3.22 2.82 1.02 10.70 Total Liabilities 2,37,077.58 2,26,785.09 2,24,459.54 2,22,229.99 2,30,492.05 Total Liabilities Growth (%) 4.54 1.04 1.00 -3.58 10.21 Total Equity 1,02,549.66 1,03,567.22 95,373.73 87,920.06 76,244.05 Total Equity Growth (%) -0.98 8.59 8.48 15.31 10.42 Current Ratio (x) 1.23 1.37 1.31 1.42 1.26 Total Debt to Equity (x) 1.32 1.33 1.50 1.73 2.09 Contingent Liabilities 21,246.24 19,620.76 23,020.82 21,540.85 24,656.26 All figures in Rs Cr, unless mentioned otherwise
Annual FY 2024 FY 2023 FY 2022 FY 2021 FY 2020 Net Cash flow from Operating Activities 18,266.28 22,776.96 19,163.58 22,844.14 6,693.88 Net Cash used in Investing Activities 2,163.04 -8,311.70 -3,667.68 -5,428.84 -8,256.27 Net Cash flow from Financing Activities -25,413.36 -11,572.49 -15,181.48 -15,274.38 6,371.55 Net Cash Flow -4,968.19 3,156.45 396.72 2,140.92 4,809.16 Closing Cash & Cash Equivalent 11,958.50 16,926.69 13,770.24 13,257.01 11,117.95 Closing Cash & Cash Equivalent Growth (%) -29.35 22.92 3.87 19.24 72.10 Total Debt/ CFO (x) 6.24 5.20 6.43 5.76 20.86 All figures in Rs Cr, unless mentioned otherwise
Annual FY 2024 FY 2023 FY 2022 FY 2021 FY 2020 Return on Equity (%) 15.12 11.72 10.52 15.26 14.31 Return on Capital Employed (%) 14.70 11.99 10.91 9.28 9.93 Return on Assets (%) 3.84 3.16 2.70 3.72 3.09 Interest Coverage Ratio (x) 7.80 7.38 6.55 4.13 5.80 Asset Turnover Ratio (x) 0.66 0.45 0.42 43.68 47.20 Price to Earnings (x) 39.84 29.07 28.65 17.21 11.86 Price to Book (x) 6.01 3.41 3.01 2.63 1.70 EV/EBITDA (x) 22.92 17.50 17.86 17.20 13.31 EBITDA Margin (%) 12.50 12.91 13.08 14.01 12.84 MANAGEMENT DISCUSSION AND ANALYSIS (FY 19-20)
Muted private sector spending
Private sector investments continued to be muted in the areas of industrial capex and building infrastructure. Public sector spending, however, remained firm and was robust in the areas of core infrastructure, driven by the Government?s commitment to boost investment across multiple infrastructure sectors.
Challenging macro environment
FY 2019-20 was a challenging year both for the Indian economy, which performed below its true potential, as well as the construction sector, which recorded a six-year low growth of 1.3%. Cement production saw a marginal decrease of 0.8% in FY 2019-20 as compared to 13.3% increase in FY 2018-19.
Tailwinds: Far and few
With a discernable thrust on renewable energy, the award of some contracts in this area has been gaining momentum, which has offset the tapering of prospects on centrally sponsored intensive electrification projects under the ?Saubhagya? initiatives. As the implementation of Mass Rapid Transit System (MRTS) at various metros progressed well, the Government?s focus has turned to Tier II cities, and opportunities are being sighted there.
L&T Share Price Forecast
PRICE
REVENUE
EARNINGS
Get multiple analysts’ prediction on L&T
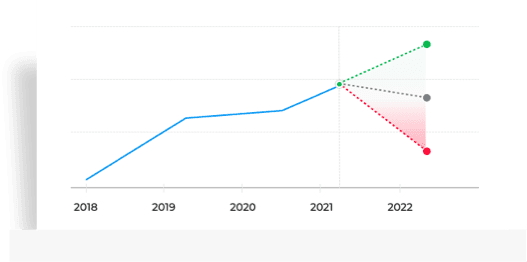
- High, low, medium predictions for Price
- Upcoming predictions for Revenue
- Details about company earnings
START FREE TRIALGet multiple analysts’ prediction on L&T
- High, low, medium predictions for Price
- Upcoming predictions for Revenue
- Details about company earnings
START FREE TRIALGet multiple analysts’ prediction on L&T
- High, low, medium predictions for Price
- Upcoming predictions for Revenue
- Details about company earnings
START FREE TRIAL
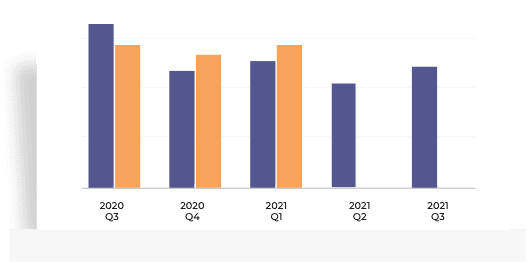
L&T Peer Comparison
L&T Stock Performance
Ratio Performance
Insights
Stock Returns vs Nifty 100
Stock gave a 3 year return of 111.34% as compared to Nifty 100 which gave a return of 49.32%. (as of last trading session)Stock Returns vs Nifty Infrastructure
Stock generated 111.34% return as compared to Nifty Infrastructure which gave investors 94.0% return over 3 year time period. (as of last trading session)
Choose from Peers
Choose from Stocks
- 1D
- 1W
- 1M
- 3M
- 6M
- 1Y
- 5Y
Loading...Insights
Stock Returns vs Nifty 100
Stock gave a 3 year return of 111.34% as compared to Nifty 100 which gave a return of 49.32%. (as of last trading session)Stock Returns vs Nifty Infrastructure
Stock generated 111.34% return as compared to Nifty Infrastructure which gave investors 94.0% return over 3 year time period. (as of last trading session)
See All Parameters
MF Ownership
3,982.71
Amount Invested (in Cr.)
6.35%
% of AUM
1.53
% Change (MoM basis)
BHARAT 22 ETF-G
Equity: Large Cap
2,799.53
Amount Invested (in Cr.)
13.54%
% of AUM
1.36
% Change (MoM basis)
2,426.70
Amount Invested (in Cr.)
2.58%
% of AUM
0.82
% Change (MoM basis)
MF Ownership as on 31 July 2024
L&T F&O Quote
Futures
Options
- Expiry
Price
3,580.60-53.65 (-1.48%)
Open Interest
18,450-4,500 (-24.39%)
Open High Low Prev Close Contracts Traded Turnover (₹ Lakhs) 3,644.70 3,644.70 3,542.00 3,634.25 31,022 1,66,491.01 Open Interest as of 05 Jul 2024
Corporate Actions
L&T Board Meeting/AGM
L&T Dividends
- Others
Meeting Date Announced on Purpose Details Jul 24, 2024 Jul 10, 2024 Board Meeting Quarterly Results May 08, 2024 Apr 24, 2024 Board Meeting Audited Results & Final Dividend Mar 27, 2024 Mar 21, 2024 Board Meeting Others Jan 30, 2024 Jan 16, 2024 Board Meeting Quarterly Results Jan 22, 2024 Dec 18, 2023 POM - Type Dividend Dividend per Share Ex-Dividend Date Announced on Final 1400% 28.0 Jun 20, 2024 May 08, 2024 Special 300% 6.0 Aug 02, 2023 Jul 20, 2023 Final 1200% 24.0 Aug 02, 2023 May 10, 2023 Final 1100% 22.0 Jul 21, 2022 May 12, 2022 Final 900% 18.0 Jul 28, 2021 May 14, 2021 All Types Ex-Date Record Date Announced on Details Bonus Jul 13, 2017 Jul 14, 2017 May 29, 2017 Bonus Ratio: 1 share(s) for every 2 shares held Bonus Jul 11, 2013 Jul 13, 2013 May 22, 2013 Bonus Ratio: 1 share(s) for every 2 shares held Bonus Oct 01, 2008 Oct 03, 2008 May 29, 2008 Bonus Ratio: 1 share(s) for every 1 shares held Bonus Sep 28, 2006 Sep 29, 2006 Jun 07, 2006 Bonus Ratio: 1 share(s) for every 1 shares held Bonus - - Aug 01, 1986 Bonus Ratio: 3 share(s) for every 5 shares held
About L&T
Larsen & Toubro Ltd., incorporated in the year 1946, is a Large Cap company (having a market cap of Rs 491,473.83 Crore) operating in Construction sector. Larsen & Toubro Ltd. key Products/Revenue Segments include Income From Construction Work, Income from Manufacturing and Trading Activities, Other Services, Other Operating Revenue, Property Development, Commission, Service (Engineering) and Lease Rentals for the year ending 31-Mar-2024. Show More
Executives
Auditors
- SN
S N Subrahmanyan
Chairman & Managing DirectorSNS N Subrahmanyan
Chairman & Managing DirectorRSR Shankar Raman
WholeTime Director & CFORSR Shankar Raman
WholeTime Director & CFOAVAnil V Parab
WholeTime Director & Sr.Exe.VPAVAnil V Parab
WholeTime Director & Sr.Exe.VPShow More - Deloitte Haskins & Sells LLP
Industry
Key Indices Listed on
Nifty 50, BSE Sensex, Nifty 100, + 35 more
Address
L&T House,Ballard Estate,Mumbai, Maharashtra - 400001
More Details
Brands

Larsen & Toubro
Trending in Markets
DATA SOURCES: TickerPlant (for live BSE/NSE quotes service) and Dion Global Solutions Ltd. (for corporate data, historical price & volume, F&O data). Sensex & BSE Quotes and Nifty & NSE Quotes are real-time and licensed from BSE and NSE respectively. All timestamps are reflected in IST (Indian Standard Time).
DISCLAIMER: Any and all content on this website including tools/analysis is provided to you only for convenience and on an “as-is, as- available” basis without representation and warranties of any kind. The content and any output of such tools/analysis is for informational purposes only and should not be relied upon or construed as an investment advice or guarantee for any specific performance/returns advice or considered as recommendation for the purchase or sale of any security or investment. You are advised to exercise caution, discretion and independent judgment with regards to the same and seek advice from professionals and certified experts before taking any decisions.
By using this site, you agree to the Terms of Service and Privacy Policy.