Company announced a dividend of Rs 5.0 per share on May 28, 2024 with record date of Sep 20, 2024.
Rites Share Price
Loading...
Rites Share Price
Advertisment
Rites share price insights
View All
Company witnessed QoQ revenue decline of 23.88%, which is lowest in the last 3 years. (Source: Consolidated Financials)
Weekly stochastic crossover appeared on week ending Sep 13, 2024. Average price gain of 8.64% within 7 weeks of this signal in last 10 years.
Stock gave a 3 year return of 152.03% as compared to Nifty Midcap 100 which gave a return of 98.99%. (as of last trading session)
Rites Ltd. share price moved up by 2.32% from its previous close of Rs 695.50. Rites Ltd. stock last traded price is 711.60
Share Price Value Today/Current/Last 711.60 Previous Day 695.50
Key Metrics
PE Ratio (x) | 39.19 | ||||||||||
EPS - TTM (₹) | 17.74 | ||||||||||
MCap (₹ Cr.) | 16,713.00 | ||||||||||
Sectoral MCap Rank | 9 | ||||||||||
PB Ratio (x) | 6.14 | ||||||||||
Div Yield (%) | 2.59 | ||||||||||
Face Value (₹) | 10.00 | ||||||||||
Beta Beta
| 0.59 | ||||||||||
VWAP (₹) | 713.70 | ||||||||||
52W H/L (₹) |
Rites Share Price Returns
| 1 Day | 2.32% |
| 1 Week | 5.77% |
| 1 Month | 8.57% |
| 3 Months | 0.91% |
| 1 Year | 36.78% |
| 3 Years | 152.03% |
| 5 Years | 200.32% |
Rites News & Analysis


Rites Share Analysis
Unlock Stock Score, Analyst' Ratings & Recommendations

- View Stock Score on a 10-point scale
- See ratings on Earning, Fundamentals, Valuation, Risk & Price
- Check stock performance
JOIN ET PRIME
Rites Share Recommendations
Recent Recos
HOLD
Current
Mean Recos by 5 Analysts
Strong
SellSellHoldBuyStrong
Buy
SellSellHoldBuyStrong
Buy
- Target₹405
- OrganizationAxis Securities
- BUY
- Target₹2040
- OrganizationAxis Securities
- BUY
Analyst Trends
| Ratings | Current | 1 Week Ago | 1 Month Ago | 3 Months Ago |
|---|---|---|---|---|
| Strong Buy | 1 | 1 | 1 | 2 |
| Buy | 1 | 1 | 1 | 1 |
| Hold | 2 | 2 | 2 | 1 |
| Sell | 1 | 1 | 1 | 1 |
| Strong Sell | - | - | - | - |
| # Analysts | 5 | 5 | 5 | 5 |
View all
Stock Recommendations
Rites Financials
Income (P&L)
Balance Sheet
Cash Flow
Ratios
Insights
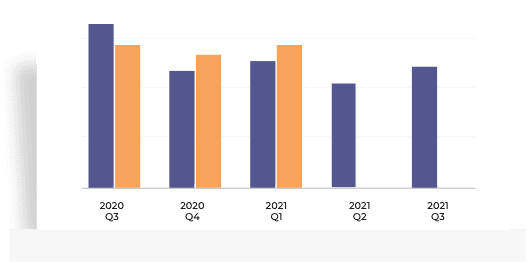
Quarterly Topline Performance
Company witnessed QoQ revenue decline of 23.88%, which is lowest in the last 3 years. (Source: Consolidated Financials)Employee & Interest Expense
Company has spent less than 1% of its operating revenues towards interest expenses and 20.08% towards employee cost in the year ending Mar 31, 2024. (Source: Consolidated Financials)
Quarterly | Annual Jun 2024 Mar 2024 Dec 2023 Sep 2023 Jun 2023 Total Income 508.25 667.68 699.85 608.81 562.63 Total Income Growth (%) -23.88 -4.60 14.95 8.21 -20.27 Total Expenses 394.39 482.84 528.94 458.58 399.01 Total Expenses Growth (%) -18.32 -8.72 15.34 14.93 -22.05 EBIT 113.86 184.84 170.91 150.23 163.62 EBIT Growth (%) -38.40 8.15 13.77 -8.18 -15.56 Profit after Tax (PAT) 79.02 126.10 120.14 101.15 108.01 PAT Growth (%) -37.34 4.96 18.77 -6.35 -22.23 EBIT Margin (%) 22.40 27.68 24.42 24.68 29.08 Net Profit Margin (%) 15.55 18.89 17.17 16.61 19.20 Basic EPS (₹) 3.29 5.25 5.00 4.21 4.49 All figures in Rs Cr, unless mentioned otherwise
Annual FY 2024 FY 2023 FY 2022 FY 2021 FY 2020 Total Assets 5,661.44 5,972.33 5,822.47 5,833.29 5,902.64 Total Assets Growth (%) -5.21 2.57 -0.19 -1.17 8.68 Total Liabilities 2,940.51 3,253.21 3,227.87 3,353.16 3,187.89 Total Liabilities Growth (%) -9.61 0.79 -3.74 5.18 8.52 Total Equity 2,720.93 2,719.12 2,594.60 2,480.13 2,714.75 Total Equity Growth (%) 0.07 4.80 4.62 -8.64 8.86 Current Ratio (x) 1.65 1.64 1.55 1.55 1.73 Total Debt to Equity (x) 0.00 0.00 0.01 0.01 0.01 Contingent Liabilities 143.53 155.56 236.35 232.26 229.68 All figures in Rs Cr, unless mentioned otherwise
Annual FY 2024 FY 2023 FY 2022 FY 2021 FY 2020 Net Cash flow from Operating Activities 431.56 559.82 309.63 515.65 319.08 Net Cash used in Investing Activities 11.07 -15.00 52.96 183.45 36.97 Net Cash flow from Financing Activities -504.08 -483.17 -440.24 -707.92 -419.71 Net Cash Flow -387.31 239.45 -68.79 1.84 -52.06 Closing Cash & Cash Equivalent 660.86 1,048.17 49.71 118.50 116.66 Closing Cash & Cash Equivalent Growth (%) -36.95 2,008.57 -58.05 1.58 -30.86 Total Debt/ CFO (x) 0.00 0.00 0.08 0.05 0.10 All figures in Rs Cr, unless mentioned otherwise
Annual FY 2024 FY 2023 FY 2022 FY 2021 FY 2020 Return on Equity (%) 17.45 20.81 20.74 18.07 23.39 Return on Capital Employed (%) 22.89 25.84 26.39 21.81 29.03 Return on Assets (%) 8.04 9.07 8.86 7.41 10.43 Interest Coverage Ratio (x) 155.04 120.27 111.34 108.05 126.24 Asset Turnover Ratio (x) 0.42 0.44 0.45 0.31 41.92 Price to Earnings (x) 35.09 15.72 12.24 13.39 9.99 Price to Book (x) 6.12 3.27 2.54 2.42 2.34 EV/EBITDA (x) 17.71 6.13 3.90 3.90 2.86 EBITDA Margin (%) 29.77 32.21 30.32 34.92 37.21
Rites Share Price Forecast
PRICE
REVENUE
EARNINGS
Get multiple analysts’ prediction on Rites
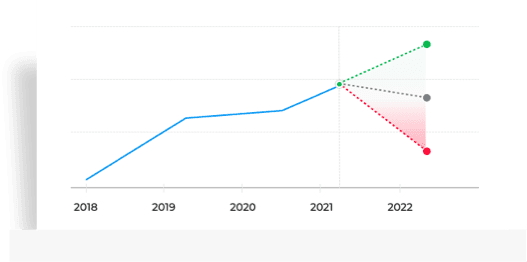
- High, low, medium predictions for Price
- Upcoming predictions for Revenue
- Details about company earnings
START FREE TRIALGet multiple analysts’ prediction on Rites
- High, low, medium predictions for Price
- Upcoming predictions for Revenue
- Details about company earnings
START FREE TRIALGet multiple analysts’ prediction on Rites
- High, low, medium predictions for Price
- Upcoming predictions for Revenue
- Details about company earnings
START FREE TRIAL
Rites Peer Comparison
Rites Stock Performance
Ratio Performance
Insights
Stock Returns vs Nifty Midcap 100
Stock gave a 3 year return of 152.03% as compared to Nifty Midcap 100 which gave a return of 98.99%. (as of last trading session)
Choose from Peers
Choose from Stocks
- There’s no suggested peer for this stock.
- 1D
- 1W
- 1M
- 3M
- 6M
- 1Y
- 5Y
Loading...Insights
Stock Returns vs Nifty Midcap 100
Stock gave a 3 year return of 152.03% as compared to Nifty Midcap 100 which gave a return of 98.99%. (as of last trading session)
See All Parameters
MF Ownership
MF Ownership details are not available.
Corporate Actions
Rites Board Meeting/AGM
Rites Dividends
- Others
Meeting Date Announced on Purpose Details Jul 31, 2024 Jul 28, 2024 Board Meeting Quarterly Results, Dividend & Bonus issue May 28, 2024 May 15, 2024 Board Meeting Audited Results & Final Dividend Feb 01, 2024 Jan 17, 2024 Board Meeting Quarterly Results & Interim Dividend Oct 31, 2023 Oct 12, 2023 Board Meeting Quarterly Results & Interim Dividend Sep 15, 2023 Aug 21, 2023 AGM A.G.M. & Rs.6.000 per share (60%) Final Dividend Type Dividend Dividend per Share Ex-Dividend Date Announced on Final 50% 5.0 Sep 20, 2024 May 28, 2024 Interim 25% 2.5 Aug 08, 2024 Aug 01, 2024 Interim 47% 4.75 Feb 09, 2024 Jan 17, 2024 Interim 45% 4.5 Nov 08, 2023 Oct 12, 2023 Interim 37% 3.75 Aug 07, 2023 Jul 17, 2023 All Types Ex-Date Record Date Announced on Details Bonus Sep 20, 2024 Sep 20, 2024 Jul 31, 2024 Bonus Ratio: 1 share(s) for every 1 shares held Bonus Aug 08, 2019 Aug 11, 2019 Jun 24, 2019 Bonus Ratio: 1 share(s) for every 4 shares held
About Rites
Rites Ltd., incorporated in the year 1974, is a Mid Cap company (having a market cap of Rs 16,713.00 Crore) operating in Services sector. Rites Ltd. key Products/Revenue Segments include Turnkey Project, Consultancy Income, Other Services, Lease Rentals, Sale of Products, Other Operating Revenue and Export Incentives for the year ending 31-Mar-2024. Show More
Executives
Auditors
- RM
Rahul Mithal
Chairman & M.D & CEOKGKrishna Gopal Agarwal
Director - Finance & CFOSJSandeep Jain
Government Nominee DirectorSSShailendra Singh
Government Nominee DirectorShow More - Pawan Puri & AssociatesJ C Bhalla & Co.
Industry
Key Indices Listed on
Nifty Smallcap 100, Nifty 500, BSE 500, + 13 more
Address
Scope Minar,Laxmi Nagar,Delhi, Delhi - 110092
More Details
FAQs about Rites share
- 1. What's Rites share price today and what are Rites share returns ?Rites share price was Rs 711.60 as on 16 Sep, 2024, 04:10 PM IST. Rites share price was up by 2.32% based on previous share price of Rs. 695.5. In last 1 Month, Rites share price moved up by 8.57%.
- 2. Is Rites giving dividend?An equity Final dividend of Rs 5 per share was declared by Rites Ltd. on 28 May 2024. So, company has declared a dividend of 50% on face value of Rs 10 per share. The ex dividend date is 20 Sep 2024.
- 3. Who's the owner of Rites?
- Promoter holding has not changed in last 9 months and holds 72.2 stake as on 30 Jun 2024
- Domestic Institutional Investors holding have gone down from 12.72 (30 Sep 2023) to 10.78 (30 Jun 2024)
- Foreign Institutional Investors holding have gone down from 3.98 (30 Sep 2023) to 3.5 (30 Jun 2024)
- Other investor holding has gone up from 11.09 (30 Sep 2023) to 13.51 (30 Jun 2024)
- 4. Which are the key peers to Rites?Top 8 Peers for Rites are Engineers India Ltd., Power Mech Projects Ltd., SEPC Ltd., Urja Global Ltd., Zodiac Energy Ltd., Rudrabhishek Enterprises Ltd., Dhruv Consultancy Services Ltd. and MITCON Consultancy & Engineering Services Ltd.
- 5. What is the market cap of Rites?Rites share has a market capitalization of Rs 16,713.00 Cr. Within Services sector, it's market cap rank is 9.
- 6. What are the returns for Rites share?Return Performance of Rites Shares:
- 1 Week: Rites share price moved up by 5.77%
- 1 Month: Rites share price moved up by 8.57%
- 7. Who's the chairman of Rites?Rahul Mithal is the Chairman & M.D & CEO of Rites
- 8. What is the CAGR of Rites?The CAGR of Rites is 7.17.
- 9. What are the Rites quarterly results?On Consoldiated basis, Rites reported a total income and loss of Rs 508.25 Cr and Rs 79.02 respectively for quarter ending 2024-06-30. Total Income and profit for the year ending 2024-03-31 was Rs 2538.97 Cr and Rs 455.40 Cr.
- 10. What are the key metrics to analyse Rites Share Price?Key Metrics for Rites are:
- PE Ratio of Rites is 39.19
- Price/Sales ratio of Rites is 6.51
- Price to Book ratio of Rites is 6.14
- 11. What is the PE & PB ratio of Rites?The PE ratio of Rites stands at 40.1, while the PB ratio is 6.28.
- 12. Who is the Chief Executive Officer of Rites?Rahul Mithal is the Chairman & M.D & CEO of Rites
- 13. What is 52 week high/low of Rites share price?52 Week high of Rites share is Rs 825.95 while 52 week low is Rs 432.30
- 14. What is the recommendation for Rites - Buy or Sell?As per Refinitiv (erstwhile Thomson Reuters), overall mean recommendation by 5 analysts for Rites stock is to Hold. Recommendation breakup is as follows
- 1 analyst is recommending Strong Buy
- 1 analyst is recommending to Buy
- 2 analysts are recommending to Hold
- 1 analyst is recommending to Sell
Trending in Markets
DATA SOURCES: TickerPlant (for live BSE/NSE quotes service) and Dion Global Solutions Ltd. (for corporate data, historical price & volume, F&O data). Sensex & BSE Quotes and Nifty & NSE Quotes are real-time and licensed from BSE and NSE respectively. All timestamps are reflected in IST (Indian Standard Time).
DISCLAIMER: Any and all content on this website including tools/analysis is provided to you only for convenience and on an “as-is, as- available” basis without representation and warranties of any kind. The content and any output of such tools/analysis is for informational purposes only and should not be relied upon or construed as an investment advice or guarantee for any specific performance/returns advice or considered as recommendation for the purchase or sale of any security or investment. You are advised to exercise caution, discretion and independent judgment with regards to the same and seek advice from professionals and certified experts before taking any decisions.
By using this site, you agree to the Terms of Service and Privacy Policy.