Advanced Google Shopping By Andreas Reiffen
•
6 likes•25,419 views

From the SMX Advanced Conference in Seattle, Washington, June 22-23, 2016. SESSION: The Mad Scientists of Paid Search. PRESENTATION: Advanced Google Shopping - Given by Andreas Reiffen, @crealytics - Crealytics, CEO. #SMX #11B
Report
Share


Advanced Google Shopping By Andreas Reiffen
- 1. #SMX #11B @AndreasReiffen Data Insights from Behind the Scenes Advanced Google Shopping
- 2. #SMX #11B @AndreasReiffen About… • Data-driven online advertising strategist • Online retail expert • Entrepreneur • €3 billion in customer revenues this year • SaaS product for Google Shopping & Search • 130 true experts in their field • Offices in Germany & UK, new office in NYC … me … crealytics & camato
- 3. #SMX #11B @AndreasReiffen Using Shopping to manage inventory Topics we‘ll cover today … How does price influence performance? Will pricing and bidding become one in the future? Can you use Shopping to push slow sellers? How to avoid common pitfalls? The role of price in Google Shopping
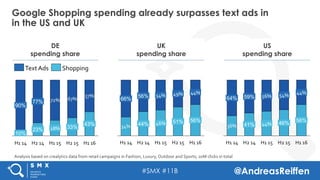
- 4. #SMX #11B @AndreasReiffen Google Shopping spending already surpasses text ads in in the US and UK DE spending share US spending share UK spending share 72% 67% 57% H1 16 43% 90% H2 14 23% 77% H2 15 28% H1 15 H1 14 33% 10% Shopping Text Ads 36% H2 14 59% H1 14 64% 41% 56% H2 15 H1 15 44% 46% 54% H1 16 44% 56% 34% H1 16 49% 56% H2 15 51%46% H2 14 44% 44% H1 15 54% 56% 66% H1 14 Analysis based on crealytics data from retail campaigns in Fashion, Luxury, Outdoor and Sports; 20M clicks in total
- 5. #SMX #11B @AndreasReiffen Using Shopping to manage inventory
- 6. #SMX #11B @AndreasReiffen You want to push slow sellers while saving budget for products which are almost sold out Product Stock level over time Action Week 1 Mark down! Week 1 Sold Out!
- 7. #SMX #11B @AndreasReiffen 40% of budget is allocated to products that will sell on their own within 3 weeks Comment PPC budget should be allocated to inventory that is high in stock or sells slowly At the moment 40% of all budget is spent on quick sellers while only 21% is spent on products that will be in stock after 3 months time PPC budget allocation by stock projection for top 100 products * top 100 products, at least 1500 clicks per week / product 40% of budget 21% of budget 10 21161413121110 15 24 20 0 2017 18 23 5 22191521 6 84 7 953 Spend
- 8. #SMX #11B @AndreasReiffen Most people do not buy what they are looking for Only 34% of conversions match the product that was clicked
- 9. #SMX #11B @AndreasReiffen Same Designer Different Designer purchaseclick 34% 16% 14% 15% 21% 64% 36% Different Category SameCategory We analysed what people actually bought when they clicked on a product ad
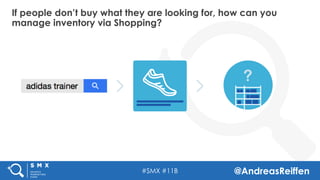
- 10. #SMX #11B @AndreasReiffen If people don’t buy what they are looking for, how can you manage inventory via Shopping?
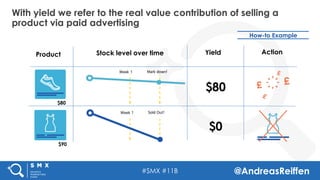
- 11. #SMX #11B @AndreasReiffen With yield we refer to the real value contribution of selling a product via paid advertising How-to Example $80 Product $80 $0 Stock level over time Yield Action Week 1 Mark down! Week 1 Sold Out! $90
- 12. #SMX #11B @AndreasReiffen Track all products which were sold after a click on a product ad How-to Example 1,000 clicks 11 Items sold x 4 x 4 x 2 x 1 ConversionsProduct clicked
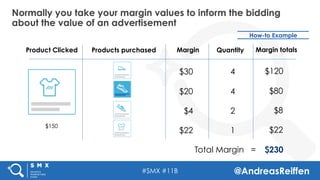
- 13. #SMX #11B @AndreasReiffen Normally you take your margin values to inform the bidding about the value of an advertisement How-to Example Products purchased 4 4 2 1 $120 $80 $8 $22 Total Margin = $230 Product Clicked Quantity Margin totals $150 Margin $30 $20 $4 $22
- 14. #SMX #11B @AndreasReiffen Based on this data the bidding calculates a value per click and suggests a bid Clicks = 1000 Value per click: $230 / 1000 Existing value per click = $0.23 How-to Example
- 15. #SMX #11B @AndreasReiffen The blue sneaker is a slow seller which we want to push How-to Example Products purchased 4 4 2 1 $120 $320 $8 $22 Total Margin/ Yield = $470 Product Clicked Quantity Margin/Yield TotalsMargin/Yield $30 $80 $4 $22$150
- 16. #SMX #11B @AndreasReiffen New bid takes yield into account and will be higher Clicks = 1000 Value per click: $470 / 1000 Updated value per click = $0.47 Value per click increases $0.47 which will be reflected in a higher bid and more sales of the black sneaker How-to Example
- 17. #SMX #11B @AndreasReiffen What people buy after a click on a product ad is often very random. Does our approach work anyhow? 1) Brands and Categories have specific stock level profiles 2) Stock level profiles per brands and categories stay consistent over time Our approach will work if … 64% same designer 65% same category Clicked to bought
- 18. #SMX #11B @AndreasReiffen Designers (and categories) have specific stock level profiles which are stable over time QUAY AUSTRALIAInventory average NEW LOOK 41% 45% 38% 30% 31% 35% 29% 24% 26% week 3week 2week 1 39% 22% avg 38% 21% 26% 31% 76% 70% 67% 2% week 2 5% week 1 2% week 3 normal low stock high stock Low stock = sold out within 2 weeks High stock = will last 3 months
- 19. #SMX #11B @AndreasReiffen When we simulate the effects on CPC, clicks and conversions, we see a more effective acquisition Account result change Product acquisition change 100% Yield 100% 100% 171% 147% 190% Cost Revenue Margin acquisition Yield acquisition Comment Our simulation shows that by incorporating yield values more high stock level products and less low stock level products will be sold Yield grows faster than revenue as yield is the KPI we are optimizing towards low stock high stock normal +87% -32% +20%
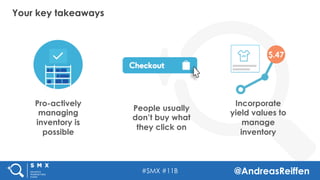
- 20. #SMX #11B @AndreasReiffen Pro-actively managing inventory is possible People usually don’t buy what they click on Incorporate yield values to manage inventory $.47 Your key takeaways
- 21. #SMX #11B @AndreasReiffen The role of price in Google Shopping
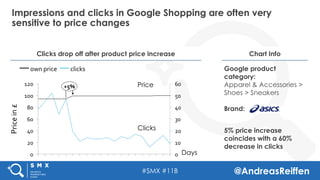
- 22. #SMX #11B @AndreasReiffen Impressions and clicks in Google Shopping are often very sensitive to price changes Clicks drop off after product price increase Chart Info 5% price increase coincides with a 60% decrease in clicks 0 20 40 60 80 100 120 0 10 20 30 40 50 60 Price in £ +5% clicks own price Google product category: Apparel & Accessories > Shoes > Sneakers Brand: Days Clicks Price
- 23. #SMX #11B @AndreasReiffen Google will take traffic away from you if your product prices exceed the average market price Product price change to avg market price Sum of Imps Sum of clicks Result +43% After 106% Before 74% -70% 30,002 Before After 100,239 683 -79% After 3,222 Before Google takes away 70% of traffic Result: to maintain traffic, you will need to bid much higher *based on 700 products Product pricing is key to success in Google shopping
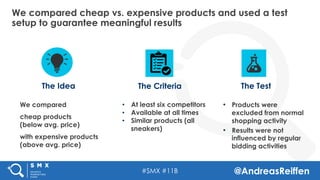
- 24. #SMX #11B @AndreasReiffen We compared cheap vs. expensive products and used a test setup to guarantee meaningful results We compared cheap products (below avg. price) with expensive products (above avg. price) The Idea • At least six competitors • Available at all times • Similar products (all sneakers) The Criteria The Test • Products were excluded from normal shopping activity • Results were not influenced by regular bidding activities
- 25. #SMX #11B @AndreasReiffen For all products we often see S-shaped curves, but cheap products generate traffic much earlier There is a direct relationship between product price, maxCPC bid and impressions Key insights Impression volume for expensive products significantly lower Cheap products hit Impression limit after 5 days 1.2 1,000 0.6 1.0 0.4 0.2 0 0.0 500 0.8 1,500 2,000 5-13-16 5-11-16 5-12-16 5-15-16 5-17-16 5-16-16 5-14-16 Max CPC Impressions per product Max CPC expensive products cheap products
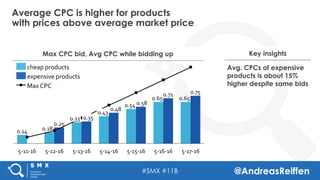
- 26. #SMX #11B @AndreasReiffen Average CPC is higher for products with prices above average market price Max CPC bid, Avg CPC while bidding up Key insights Avg. CPCs of expensive products is about 15% higher despite same bids 5-16-16 5-17-16 0.25 5-11-16 0.43 0.75 0.65 0.71 0.65 5-15-16 0.58 0.54 5-14-16 0.48 0.35 5-13-16 0.33 5-12-16 0.18 0.14 cheap products Max CPC expensive products
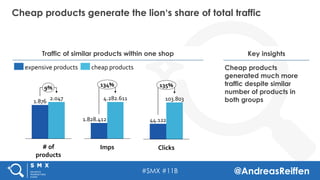
- 27. #SMX #11B @AndreasReiffen Cheap products generate the lion‘s share of total traffic Traffic of similar products within one shop Key insights Cheap products generated much more traffic despite similar number of products in both groups Imps 134% 4.282.611 1.828.412 103.803 135% Clicks 44.122 2.047 9% # of products 1.876 expensive products cheap products
- 28. #SMX #11B @AndreasReiffen Despite getting more traffic, the performance of the cheaper products is much more efficient Performance of similar products within one shop Key insights Number of orders through cheap products almost 3 times higher Higher CR resulting in CPO being ~30% lower Cheap products generate 280% more conversion 40 28 -29% CPO Conversions 1,042 +280% 274 +61% 0,6% CR 1,0% expensive products cheap products
- 29. #SMX #11B @AndreasReiffen 180 55 0 5 45 15 50 40 10 There is not really a long tail: A small number of products drive the majority of the sales Conversions per product multi brander UK Key insights More significantly than in search, shopping conversions are driven by just a few products Concentrate on those products for account optimisation. Top 10% products = 58% conversions *Chart displays all products with conversions (448) Expensive Cheap
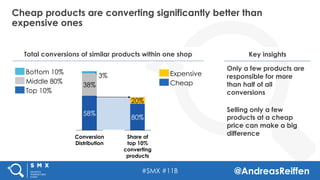
- 30. #SMX #11B @AndreasReiffen Cheap products are converting significantly better than expensive ones Key insights Only a few products are responsible for more than half of all conversions Selling only a few products at a cheap price can make a big difference Total conversions of similar products within one shop Conversion Distribution 3% 38% 58% Top 10% Middle 80% Bottom 10% 20% Share of top 10% converting products 80% Cheap Expensive
- 31. #SMX #11B @AndreasReiffen Your key takeaways Don’t overbid on expensive products, rather consider price changes Price and bid management will be merged one day Discounting only a few select products could be a killer strategy $.47$.47-50%
- 32. #SMX #11B @AndreasReiffen SEE YOU AT THE NEXT #SMX! Thank you! Subscribe to our blog blog.crealytics.com